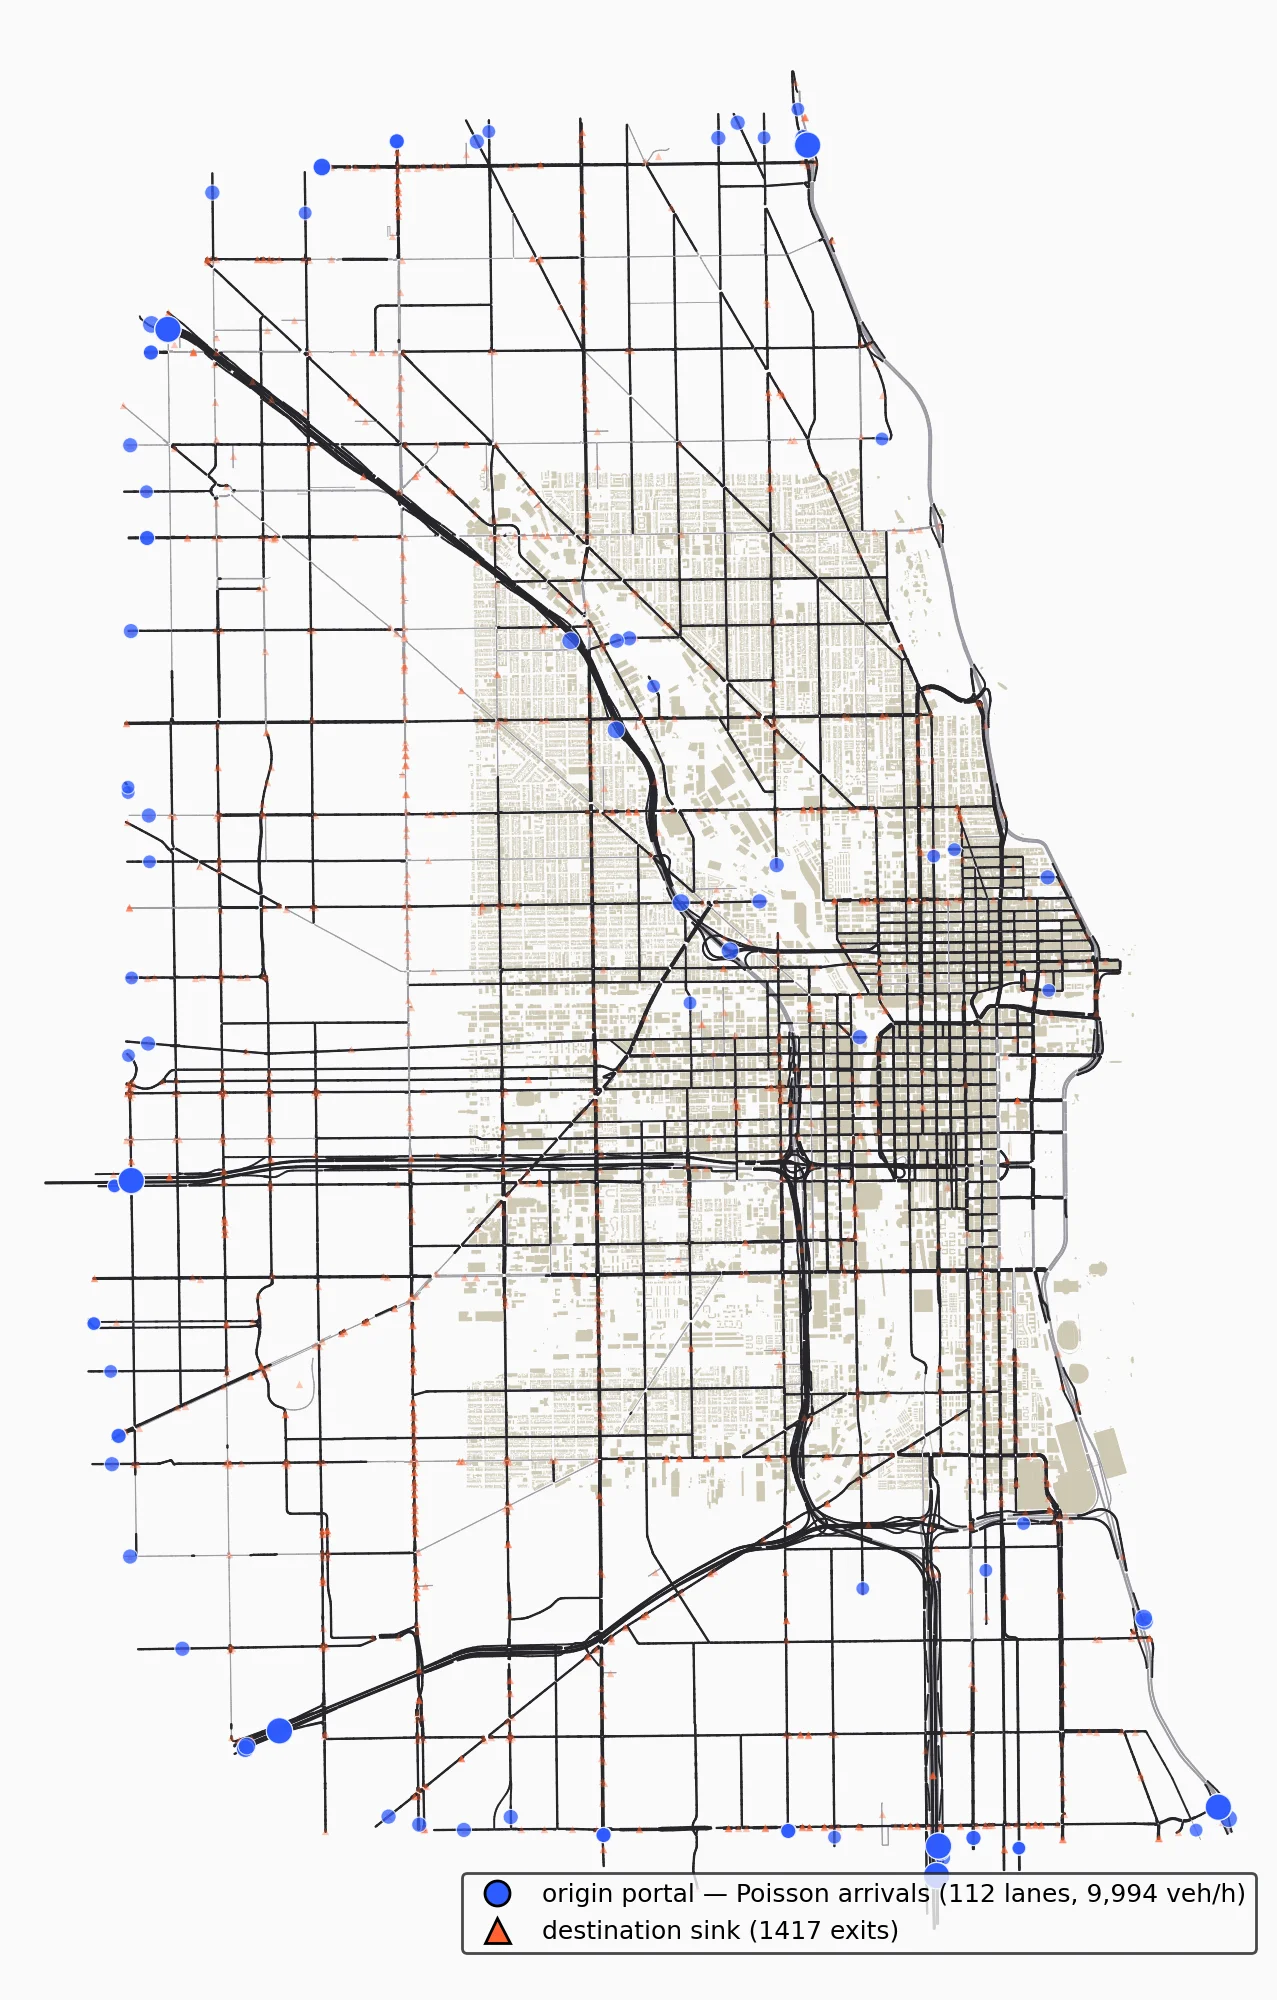
The Loop and the Kennedy — 24k lanes of perfect grid. Interactive simulation replay is in the oven — this network is one of the atlas regions the simulator runs on.
The overlay is the AM-peak demand story: cobalt dots are the Poisson arrival portals (112 lanes, ~10k veh/h, dot size = flow); the faint orange field is every lane a trip can end on (1,417 exits); the warm-gray texture is real building footprints (42k from OpenStreetMap — the demand model's trip sources and targets). Drivers pick their own exits — the sim only decides who arrives, when, and how badly they want in.